top of page

See how much faster your Spark workloads run on the Analytics Processing Unit (APU)
Predict your performance and TCO gains with three ways to test your workload - upload and query instantly in the browser, run the CLI locally in your own environment, or compare against TPC-DS benchmarks.
What you'll see in your report
A clear, query-level view of how your Spark workloads perform on the APU compared to your current setup, using your real data.
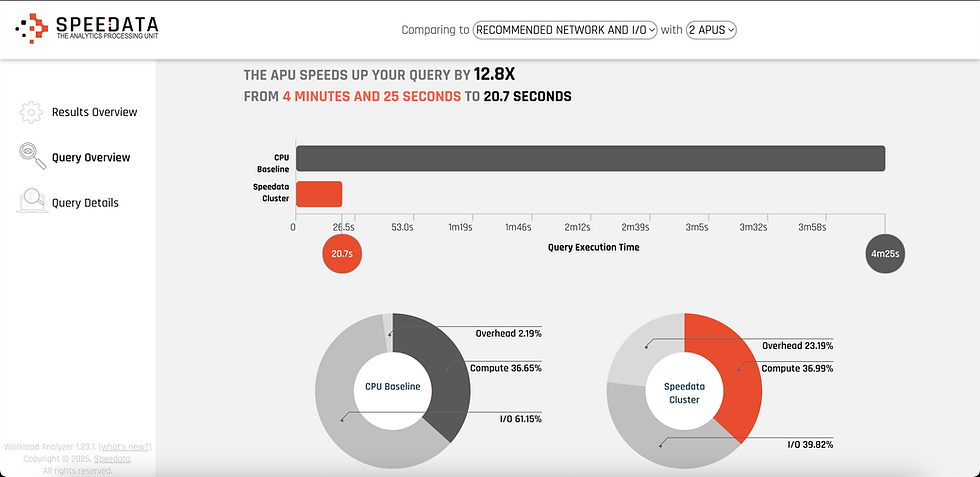
Per-query acceleration
See exactly how much faster each query runs on the APU, with before-and-after execution times and acceleration multiples.
Workload-level performance summary
A high-level view across your entire workload so you can quickly identify total impact and the queries that benefit most.
Time breakdown by compute, I/O, and overhead
Understand where your jobs spend time today and how that shifts on the APU.
bottom of page